International
Nitrogen efficiency of wheat varieties
Fertilisation is largely capped by the amended fertilisation ordinance in Germany; further yield increases are therefore only possible through increased nutrient efficiency. How can this characteristic be taken into consideration when choosing the variety? This question is raised in particular for quality wheat with regard to nitrogen as the limiting building block in protein synthesis.
What exactly is N-efficiency?
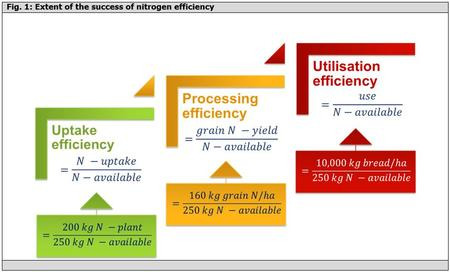
When nitrogen efficiency is discussed, generally this means the processing efficiency – in other words the part of the N supply which is recovered in the harvested product. With cereals this is almost exclusively the grain nitrogen content, calculated from the grain dry matter, raw protein content and a conversion factor1. This must be distinguished from the “uptake efficiency” with regard to the nitrogen acquirement by the entire plant in the course of vegetation.
The factors influencing N-uptake and processing efficiency are widespread, and correspond with almost all the horticultural measures. If these are optimised, the uptake efficiency is determined by the total biomass yield of the variety, its physiological activity and especially the rooting performance. The processing efficiency is significantly influenced by the sink capacity², the harvest index and the N-metabolism of the variety. The health and persistence of a plant also has a huge influence on the N-efficiency: the later the development, the better the soil nitrogen utilisation.
And the longer and less disturbed the vegetation is, and when sufficient water and nutrients are available, then the greater is the result of the N-uptake and time.
How large are the differences in the varieties?
Substantial one could initially assume, after all the varieties differ considerably both in their grain yield and the crude protein and grain nitrogen content. In reality, however, the differences in their grain nitrogen yield in the varieties are diminishing. In the current wheat range, the best and worst varieties differ by 30 kg/ha, in the top group by around 10 kg/ha.
This similarity in N-removal can be traced back to the negative relationship between grain yield and crude protein content, referred to quite appropriately by farmers as “protein dilution”. This is due primarily to the different ENERGY requirements of biosynthesis: theoretically, 1 g glucose can be used to make 0.83 g carbohydrate, but only 0.43 g protein (or 0.33 g fat). In all the approved varieties, the grading of grain yield drops on average by 0.7 with every additional point for raw protein. Transferred to practical experience – assuming 80 dt/ha with 12.5 % raw protein – the grain yield changes by around 7.5 dt/ha for each per cent of protein for the variety on average!
However, the correlation of both characteristics is not very close at only 64%. Thus, there are differences in the grain nitrogen yield which must be taken into consideration when selecting the variety. Younger varieties like FRANZ, Reform or BONANZA, belong to the varieties with considerably higher N-efficiency – known as “regression breakers” – however, so do some older approved varieties like GENIUS, Asano and Akteur.
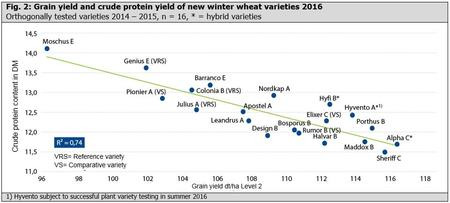
Fig. 2 illustrates the correlation between yield and protein in new wheat varieties 2016 as an example. Six new varieties – among them the already widely bred varieties NORDKAP and PORTHUS – lie above the regression line, thereby bringing comparatively higher grain protein yields. Hyvento, HYFI and LG Alpha are at the same time three of these N-efficient newly developed hybrid varieties. This is very welcome as these generally have a higher stress tolerance and yield stability, which means considerably better performance is expected above all in less favourable sites.
In the end the use efficiency counts
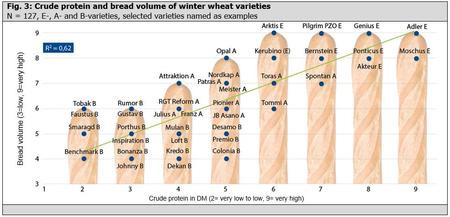
Differences in the processing efficiency and with it the N-removal are above all relevant for variety selection if protein is evaluated as a nutrient, especially in fodder cereals. However, protein content as a main selection criterion is increasingly viewed critically for soft wheat. The discussion concerning this already began in this paper 26 years ago – triggered by low protein elite wheat from the new Federal States (“Borenos”). The relationships here are clear: while the protein content is generally positively correlated with the baking quality within a variety, particularly for E- and A-varieties with high baking protein quality, however, looking at the varieties as a whole, this tight relationship does not exist (Fig. 3).
This way an average protein content (5) can lead to bread volumes of level 4 and even 8 (Fig. 3). With 12.8 % crude protein content bread volumes of 580 or 680 ml can be baked, B- or E-standard depending on the variety! The chart read from left to right shows: The required bread volumes of 630 ml, correspondingly grade 6, can already be achieved with a very low protein content (2) – or maybe only with a high one (6). TOBAK or FAUSTUS suffice therefore with about 12 % raw protein; Tommi needs 13.2 %!
The trade needs a new measure of efficiency
This must no longer be measured by the grain nitrogen content of a variety, but by the actual use, in other words bread, meat, starch or alcohol. For bread wheat, this means the highest yield performance coupled with high flour, pastry, and volume production: in other words the greatest possible amount of baked goods per hectare. Varieties with this combination of characteristics have a very high utilisation efficiency (Fig. 1), especially because they realise high yields due to their low raw protein content.
They remove little nitrogen from their site, with regard to a specified amount of bread, and use this particularly efficiently and in an environmentally-friendly manner.
Example: The variety TOBAK with 11.5 % protein makes exactly the same amount of bread from the same amount of grain as some A-wheat varieties with 13 %. The B-grade is purely the result of the low grain nitrogen-content (= crude protein).
If in the future quality wheat varieties are to be accepted for the same baking properties with one percent less protein content, then the yield can be increased by breeding while at the same fertilisation level of 100 dt/ha to 108 dt/ha. When considering 10 t of wheat grain, the emission of climate-damaging gases drops by 112 kg/ha, which corresponds to a carbon footprint of driving 1,000 km in a small car.
Low-protein quality wheat varieties, represented here by the varieties TOBAK, PORTHUS and GUSTAV, are therefore the future types of quality wheat. In this way it is possible to achieve further elevated yields with limited N-fertilisation. From this it can be assumed that the market must adjust to these new variety types with diminishing protein content in the coming years – meaning more cost-effective and resource-efficient standard flours.
However, in addition to the future low-protein standard qualities, the market also needs gluten- or protein-rich quality wheat for more demanding flour. For frozen pastry products, burgers, bread for toast or stollen – as well as for specific export markets. These are quality varieties such as GENIUS or NORDKAP, which assimilate as much nitrogen as possible to high quality gluten despite a limited N-supply, with at the same time higher N-processing and utilisation efficiencies.
| Conclusion The market and with it the trade needs both N-efficient varieties with more yield and N-efficient varieties with more protein. Breeding offers both, the farmer decides: whether the genotype steers the sun ENERGY primarily to carbohydrate formation or to the more ENERGY-demanding protein synthesis. |
Sven Böse
1 After the raw protein content has been diverted from the nitrogen content, this cannot be reversed. The conversion factor for this is 5.7 for wheat, 6.25 for other cereals.
2 By “sink” we mean the utilisation and attraction sites for the formed assimilates, in other words for cereals the grain facilities.
Last updated: 04.05.16


